
Demonstrating return on investment is much easier in some parts of the business than in others. In business development, for example, it’s much easier to prove that allocating additional sales resources or tools can directly lead to an increase in quantifiable revenue, which is then factored into a clean-cut ROI formula.
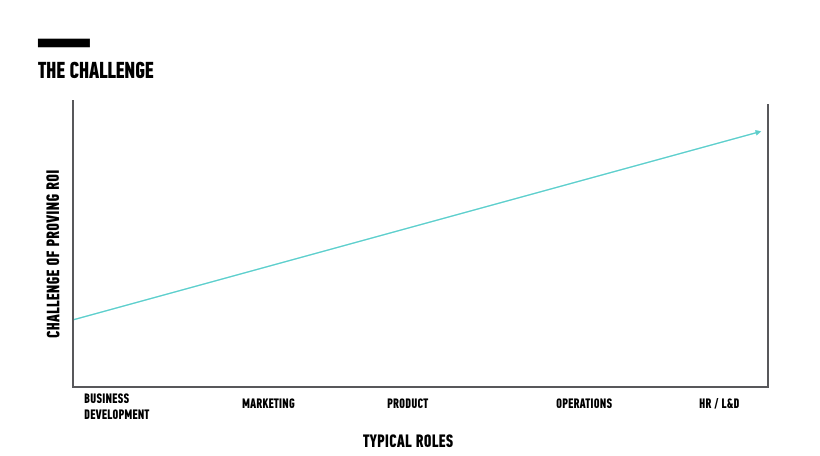
With roles that are more operations-based, like learning & development, the tools available to prove ROI of L&D programs tend to be much more descriptive and subjective, rather than numerical and objective. What’s more, L&D team members are charged with the nebulous duty of evaluating what the appropriate data points are, acquire that data, interpret it, and present the findings.
This is the challenge facing L&D professionals across the globe as their businesses scramble to transform in the digital age and the war for talent rages on.
This challenge, however, is actually a massive opportunity for the L&D community to test systems for demonstrating the impact of their programs. By offering their business partners a model for illustrating ROI of their initiatives, L&D leaders can prove their contributions to their organization’s broader goals and earn a seat at the executive table.
So let’s get to it, shall we?
In this blogpost, we’ll explore how L&D executives can establish a model for proving return-on-investment of their initiatives and establish themselves as crucial elements of an organization’s success.
Step 1: Know Your Audience
When developing an L&D ROI model for your organization, first put yourself in your boss’s shoes. That person will eventually be the audience of the data you deliver and story you tell. When asking to understand the ROI of L&D, what are they really asking for? A quick empathy exercise is a great method for understanding what they’re hoping to accomplish.
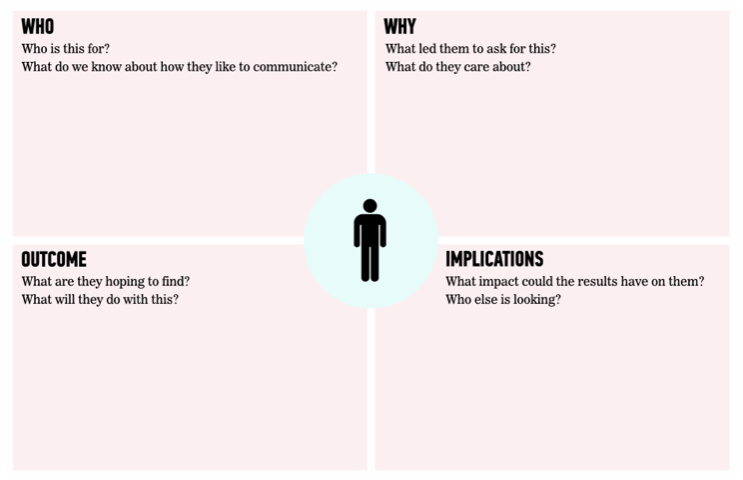
Start in the upper left of this empathy map, proceed clockwise, and answer the questions with your boss in mind. The answers will help you define the true goals and objectives they are trying to reach.
Once you’ve established a hypothesis of your audience’s objectives, you should dive a little deeper with an in-person interview about their motivations behind these goals and objectives. Again, we’re trying to explore what your audience is truly trying to achieve through an ROI model rather than what they’re simply stating up front. A good method for defining true goals and objectives is through a “five whys” exercise.

Five Whys is a methodology that stems from six sigma in order to find the root cause of a problem. We can use it here to ensure the data you collect is going to serve the purpose of the story that needs to be told and will be used correctly.
Finally, ask about the broader business context and story behind this question. Asking “What else do you think I should know?” gives your boss or audience the opportunity to share what’s on their mind, which may not be directly tied to one of your earlier questions.
Step 2: Unpack the Company’s Goals
After exploring your audience’s true goals and objectives, unpack them into key performance indicators (or KPIs). While company goals describe what your team would like to accomplish (ex: “Increase adoption of online learning”), KPIs support those goals by assigning trackable metrics to them (ex: “Number of online lessons completed”). Hopefully, the owners of lines of business or managers can provide these to you.
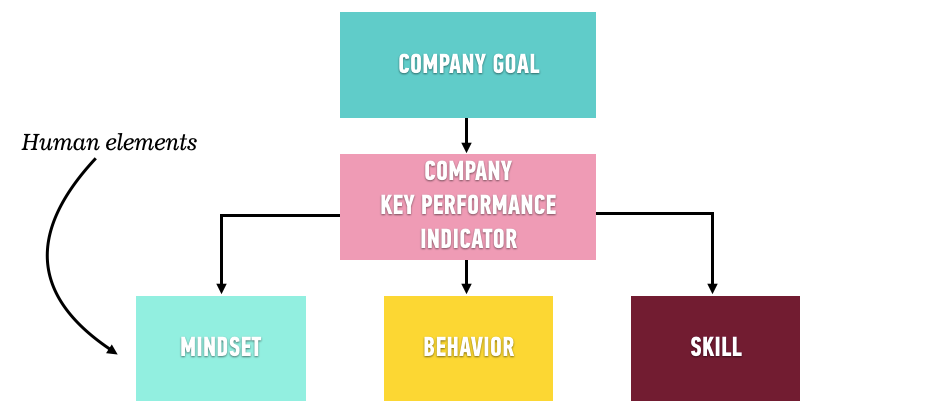
After unpacking goals and KPIs, you can translate what the business wants to achieve into the human elements that will lead to achieving that objective.
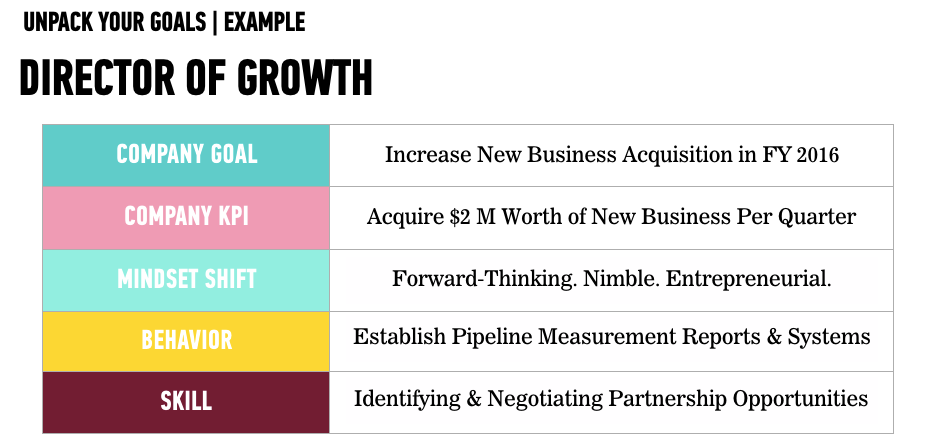
We at GA like to plot out these human elements of Mindset, Behavior, and Skill on to a chart for each learning audience. Below is an example of unpacking company goals into the appropriate mindset, behaviors, and skills that that company’s Director of Growth needs to be successful.
After identifying the appropriate human elements contributing to organizational goals, you can begin assessing your training programs’ effectiveness at affecting these factors.
Step 3: Gather Data
To illustrate the success of your training programs, first ensure that you’re gathering the right data to tell your story. At GA, our corporate training team acquires data on learning experiences through both pre and post surveys—issued to both training program participants as well as their managers.
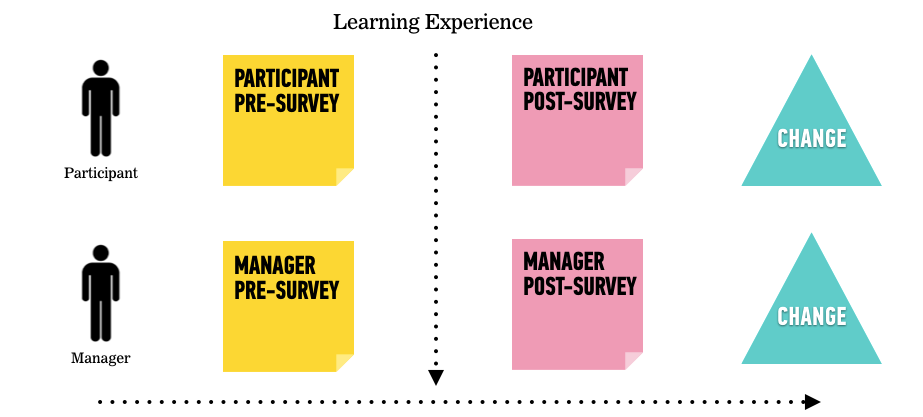
When drafting a survey, ensure that each survey item speaks to the Mindsets, Behaviors or Skills that we defined in the previous Unpacking Exercise above. To frame results in a quantifiable manner, you draft questions so that participants are able to provide answers on a 1-5 scale (1=strongly disagree, 5=strongly agree).
Does your organization have survey fatigue? Here are some best practices to help get those responses in:
- Survey questions should be unique to your business – Ensure that survey questions relate to the unique knowledge, mindset, and skills that relate specifically to your business scenario.
- Keep friction to a minimum – While data acquisition is essential to proving ROI, it can be rather disruptive to a training program. Keep your surveys to no more than three quantitative questions.
- Be conscious of timing – The timing in which you issue surveys should be determined by the content of your training programs. You may need to wait for several days or weeks to accurately measure improvement and give time for participants to apply what they’ve learned.
- Inform participants why you’re gathering data – Nobody likes to blindly give away information. Informing participants about why you are running a survey will solicit more genuine, thoughtful replies and will make them feel included in the process.
- Survey both participants and their managers – Acquiring data from these two perspectives gives you a more robust perspective of the effects your programs are having.
Step 4: Tell the Story
As the author of your L&D ROI story, you are also the data-editor-in-chief. It’s up to you to infer the meaning of your data and present it to your audience in a clear, easy-to-digest manner. Package your findings in a way that tells the story you want to tell.
When telling your data story, keep your specific audience in mind. Refer back to your empathy map at the beginning of this blogpost to help frame your story. What is your audience going to think, feel, and do because of the information that you are about to provide? Trim your content so that you are only illustrating takeaways that are clear and well-supported by your data.
When presenting your findings, be sure to only communicate one conclusion or key takeaway at a time. Presenting multiple points at once dilutes your focus and makes it difficult for your audience to understand the point that you are ultimately trying to get across.
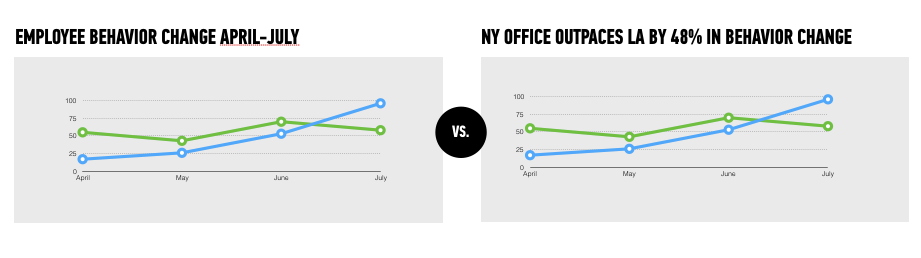
And, again, your key points should be abundantly clear. The text headers of your slides or sections of your report are vital real estate and should communicate your actual conclusion instead of simply being descriptive.
Which of these headers tells a better story?
While it’s difficult to illustrate the exact ROI of your L&D programs, it’s certainly far from impossible. Testing a model that makes sense for your organization by involving the right stakeholders allows you to take control of the ROI story you tell.
Explore GA’s Corporate Training Solutions